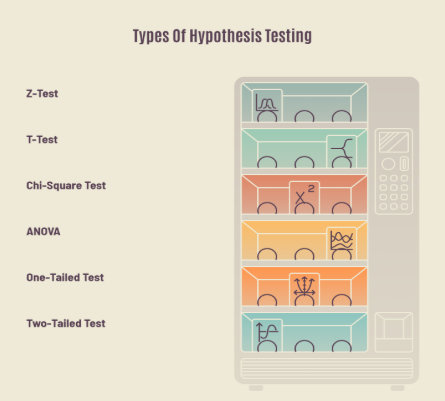
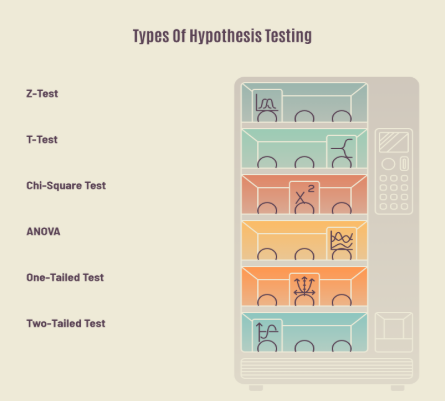
Z-Test: Used to examine whether a sample mean or proportion differs significantly from a population value. It is generally applied when the population variance is known or the sample is sufficiently large under suitable conditions.
T-Test: Used to compare means when the population standard deviation is unknown. It is commonly applied to smaller samples, subject to the test's assumptions.
Chi-Square Test: Used to examine relationships between categorical variables or compare observed frequencies with expected frequencies.
ANOVA (Analysis of Variance): Helps compare the means of three or more groups to determine whether at least one group differs significantly.
One-Tailed Test: Examines whether an effect or difference exists in a specific direction, such as whether sales have increased.
Two-Tailed Test: Examines whether a difference exists in either direction, without specifying whether the result should be higher or lower.
The choice of test depends on the type of data and the question being investigated. For example, a company comparing average sales across three regions may use ANOVA, while a researcher studying the relationship between customer age groups and product preferences may use a chi-square test.
Strengthen Your Business Management Skills with IIM Bangalore Understand how hypothesis testing helps businesses analyse data, evaluate assumptions, measure outcomes and make informed decisions. Explore the role of statistical methods in business research, performance analysis and strategic planning. Key Learning Areas: Data-Driven Decision-Making: Learn how businesses use data to support decisions. Business Analytics: Understand how statistical methods help evaluate business performance. Research and Analysis: Explore how hypotheses are tested to draw meaningful conclusions. Strategic Planning: Understand how data insights support business strategies.
Explore learning opportunities at IIM Bangalore to strengthen your understanding of business analytics and management decision-making. |
8-Steps Hypothesis Testing Guide
Hypothesis testing follows a sequence of steps that helps researchers move from a research question to a statistical conclusion. Each step has a specific purpose, from defining the claim to interpreting the results.
The eight steps are:
Define the Research Question: Identify the issue or assumption that needs to be examined. For example, determine whether a new training program improves employee productivity.
Formulate the Hypotheses: Create the null hypothesis and alternative hypothesis based on the research question.
Select the Significance Level: Choose the acceptable probability of making a Type I error. A significance level of 0.05 is commonly used.
Choose the Appropriate Statistical Test: Select a test based on the data type, sample size, research design and statistical assumptions.
Collect Sample Data: Gather relevant information from the population or selected sample using a suitable method.
Calculate the Test Statistic: Apply the selected statistical formula to obtain the test statistic and corresponding p-value.
Make a Statistical Decision: Compare the p-value with the significance level. Reject the null hypothesis if the p-value is less than or equal to the significance level. Otherwise, fail to reject it.
Interpret and Report the Results: Explain what the statistical findings mean in relation to the original research question.
Following these steps helps maintain consistency in statistical analysis and makes research findings easier to interpret.
Hypothesis Testing Formula
The formula used in hypothesis testing depends on the statistical test being performed. Different tests have different calculations, but each produces a test statistic that helps evaluate the null hypothesis.
Some commonly used hypothesis testing formulas include:
1. Z-Test Formula
Z=x-/n
Where:
2. T-Test Formula (One-Sample)
t=x-s/n
Where:
3. Chi-Square Test Formula
2=(O-E)2E
Where:
O = Observed frequency
E = Expected frequency
4. ANOVA F-Test Formula
F=Between-groupvarianceWithin-groupvariance
These formulas are used to calculate test statistics. The final decision also depends on factors such as degrees of freedom, significance level and the distribution associated with the selected test.
What Are Hypothesis Testing Examples?
Hypothesis testing is used across different industries to evaluate business assumptions and research questions. It helps organisations understand whether changes in their products, services or processes have produced measurable results.
Here are some practical examples:
Marketing Campaign Performance: A company wants to determine whether a new advertising campaign has increased website conversions. It compares conversion rates before and after the campaign.
Employee Training: An organisation introduces a training program and wants to know whether it improves employee performance. It compares assessment scores before and after training.
Product Quality: A manufacturing company wants to determine whether a new production method reduces product defects. It compares defect rates under the old and new methods.
Customer Satisfaction: A business introduces a new customer support system and studies whether satisfaction scores have changed.
Retail Pricing: A retailer wants to understand whether a discount strategy increases the average number of products purchased per customer.
In each situation, the organisation starts with a specific claim and uses sample data to evaluate it. The statistical test helps determine whether the observed result provides sufficient evidence for a conclusion.
What Are Type I and Type II Errors in Hypothesis Testing?
Hypothesis testing involves making decisions based on sample data, so there is always a possibility of reaching an incorrect conclusion. Two common errors are Type I and Type II errors.
Type I Error (False Positive)
A Type I error occurs when the null hypothesis is rejected even though it is actually true. In simple terms, the analysis identifies an effect or difference that does not really exist.
For example, a company may conclude that a new advertising campaign has increased sales when the campaign has not produced a genuine improvement.
Type II Error (False Negative)
A Type II error occurs when the null hypothesis is not rejected even though it is false. This means the analysis fails to identify an actual effect or difference.
For example, a new employee training program may genuinely improve productivity, but the study fails to detect the improvement.
The key differences are:
Basis | Type I Error | Type II Error |
Meaning | Rejecting a true null hypothesis | Failing to reject a false null hypothesis |
Also Known As | False positive | False negative |
Probability | Alpha (α) | Beta (β) |
Main Risk | Identifying an effect that does not exist | Missing an effect that actually exists |
Example | Concluding that a product change improved sales when it did not | Failing to identify an actual improvement in sales |
The probability of a Type I error is controlled through the significance level. The probability of a Type II error is influenced by factors such as sample size, variability and the size of the actual effect.
Common Mistakes in Hypothesis Testing
Although hypothesis testing follows a structured process, mistakes in research design, data collection or interpretation can affect the reliability of its findings.
Some common mistakes include:
Using the Wrong Statistical Test: Selecting a test without considering the data type or statistical assumptions can produce misleading results.
Ignoring Sample Size: A sample that is too small may fail to identify meaningful differences, while a poorly selected sample may not represent the population.
Misinterpreting the P-Value: A low p-value does not indicate the size or practical importance of an effect. It also does not directly measure the probability that the null hypothesis is true.
Confusing Correlation with Causation: A statistical relationship between two variables does not automatically mean that one causes the other.
Ignoring Statistical Assumptions: Some tests require conditions such as independence, normality or equal variances. Violating these assumptions can affect the results.
Treating Statistical Significance as Practical Importance: A result may be statistically significant but have little real-world value, particularly in studies with large samples.
Avoiding these mistakes helps researchers interpret findings more accurately and draw conclusions that are relevant to the problem being studied.
What Is the Difference Between Null and Alternative Hypotheses?
The null and alternative hypotheses are the two statements used to frame a hypothesis test. They represent different positions about the population being studied and guide the statistical analysis.
Basis | Null Hypothesis (H₀) | Alternative Hypothesis (H₁) |
Meaning | Assumes no significant effect, difference or relationship | Suggests that an effect, difference or relationship exists |
Purpose | Serves as the starting assumption for testing | Represents the claim being investigated |
Symbol | H₀ | H₁ or Hₐ |
Statistical Decision | Can be rejected or not rejected | Gains support when the null hypothesis is rejected |
Example | A new marketing strategy does not change sales | A new marketing strategy changes sales |
For example, a business wants to study whether introducing a loyalty program changes customer spending.
The statistical analysis uses sample data to determine whether there is sufficient evidence to reject the null hypothesis.
Conclusion
Hypothesis testing helps individuals examine assumptions, interpret statistical data and make informed decisions across research and business settings. Understanding its types, formulas and steps makes it easier to draw meaningful conclusions from data.
These concepts are valuable for students and professionals pursuing careers in management and analytics. To build your management knowledge further, explore the online programs offered by IIM Bangalore and take the next step in your learning journey.