IIMBx - Digital Learning Foundation

What Is Business Analytics? Types, Tools and Use Cases

By Swati Bajaj

Updated on Oct 27, 2026

Share:

All businesses possess data, but not all of them know how to put the data to use.

  • "Definition of Business Analytics: a process wherein the data is used to analyze the performance of the firm as well as make decisions."

  • In the process, statistics and mathematics are used in order to analyze previous events like sales, costs, customers, and marketing effects.

  • Decisions made after analyzing include decisions regarding cost, price, and market.

  • Business analytics consists of descriptive, diagnostic, predictive, and prescriptive analytics. Tools like Excel, SQL, Python, Tableau, and PowerBI are used by groups. These tools include those that you may encounter in marketing, finance, human resources, banking, eCommerce, and other various fields.

This blog helps you understand business analytics in easy terms, even if you are not familiar with the term. You will be able to know the difference between BI and data science, and the process and role of AI in it. You will also get to know about its applications and the tools and skills required to become an analyst.

What Is Business Analytics?

Business analytics involves analyzing what is happening in a business by analyzing data so as to decide the way forward. Instead of making guesses, a business analyzes data such as sales, number of visits, costs, and reviews to make a decision.

Use of business analytics in businesses is common since decisions that are made based on facts are better than those made on opinions.

It has four basic parts:

Part

What it means

Simple example

Data collection

Gathering data from sales, websites, apps, and customer records

A shop saves every bill in its system

Analysis

Looking at the data to find patterns and reasons

Checking which products sell more in winter

Visualization

Showing results in charts and dashboards

A bar chart of monthly sales by city

Decision making

Using the findings to take action

Stocking more winter items before the season starts

Business Analytics vs Business Intelligence vs Data Analytics vs Data Science

These four terms get mixed up a lot, and they do overlap. The table below shows where each one puts its focus.

Term

Main focus

Key question it answers

Typical output

Business analytics

Using data to solve business problems and guide decisions

What should we do, and why?

Recommendations, forecasts, strategy inputs

Business intelligence

Tracking and reporting what has already happened

What happened in the business?

Dashboards, scheduled reports

Data analytics

Examining data sets to find patterns and answers

What does this data tell us?

Findings, summaries, charts

Data science

Building models and algorithms, often with machine learning

What is likely to happen, and can a system learn it?

Predictive models, algorithms, automated systems

A quick way to remember it: business intelligence looks back, business analytics connects the data to a decision, and data science builds the more technical models behind some of those decisions.

Also Read: Business Statistics: Meaning, Types, Applications and Examples

Types of Business Analytics

There are normally four kinds of business analytics. Each answers a unique question, and most businesses use all four kinds of analytics.

Descriptive Analytics

  • Descriptive analytics tells you what has already happened. It answers the question, “What happened?”

  • Example: An online shopping company in India checks last month’s orders by city and product type. This shows which cities bought the most during a festive sale.

Diagnostic Analytics

  • Diagnostic analytics finds out why something happened. It answers the question, “Why did it happen?”

  • Example: A retail chain sees that sales dropped in one region. The team checks stock, prices, and how many people visited the stores. They find that a popular product was not available for two weeks.

Predictive Analytics

  • Predictive analytics uses past data to guess what may happen next. It answers the question, “What is likely to happen?”

  • Example: A bank looks at how people paid back loans before and how they use their accounts. This helps the bank guess which loan applicants may not be able to repay.

Prescriptive Analytics

  • Prescriptive analytics suggests the best next step. It answers the question, “What should we do about it?”

  • Example: An online shopping app decides which discount to show to which group of customers. The goal is to improve sales without losing too much profit.
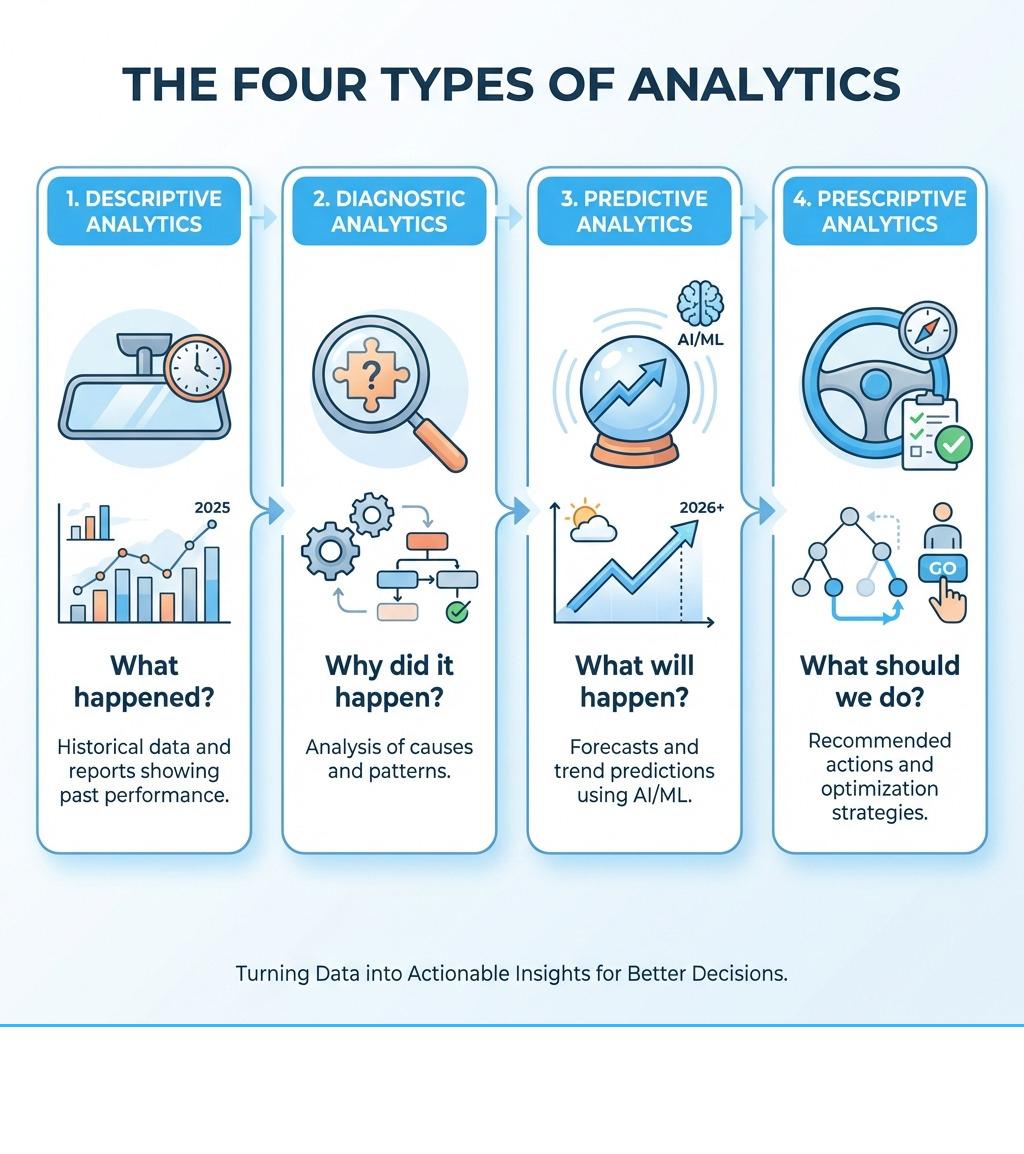
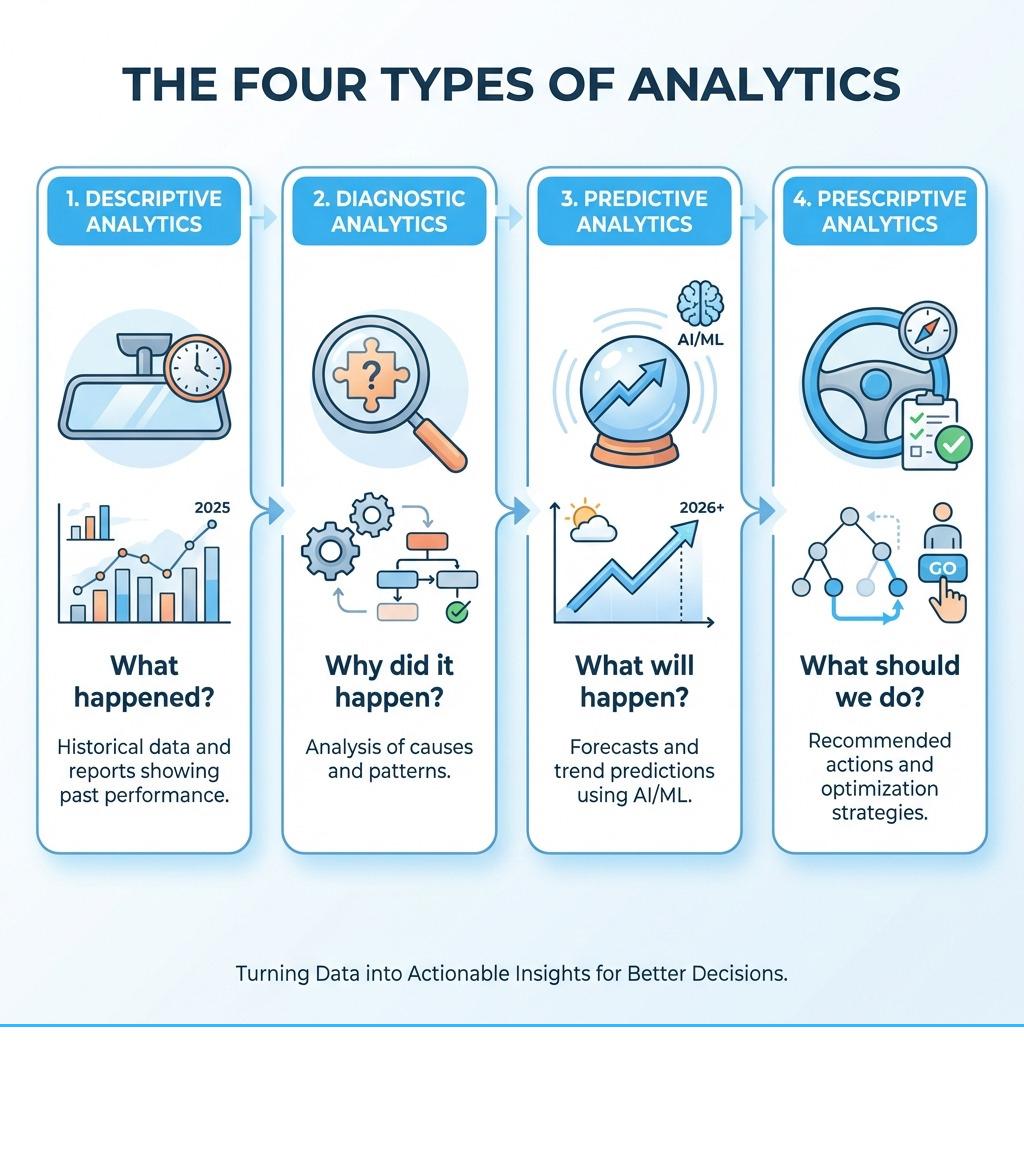
Blog image
Types of Business Analytics

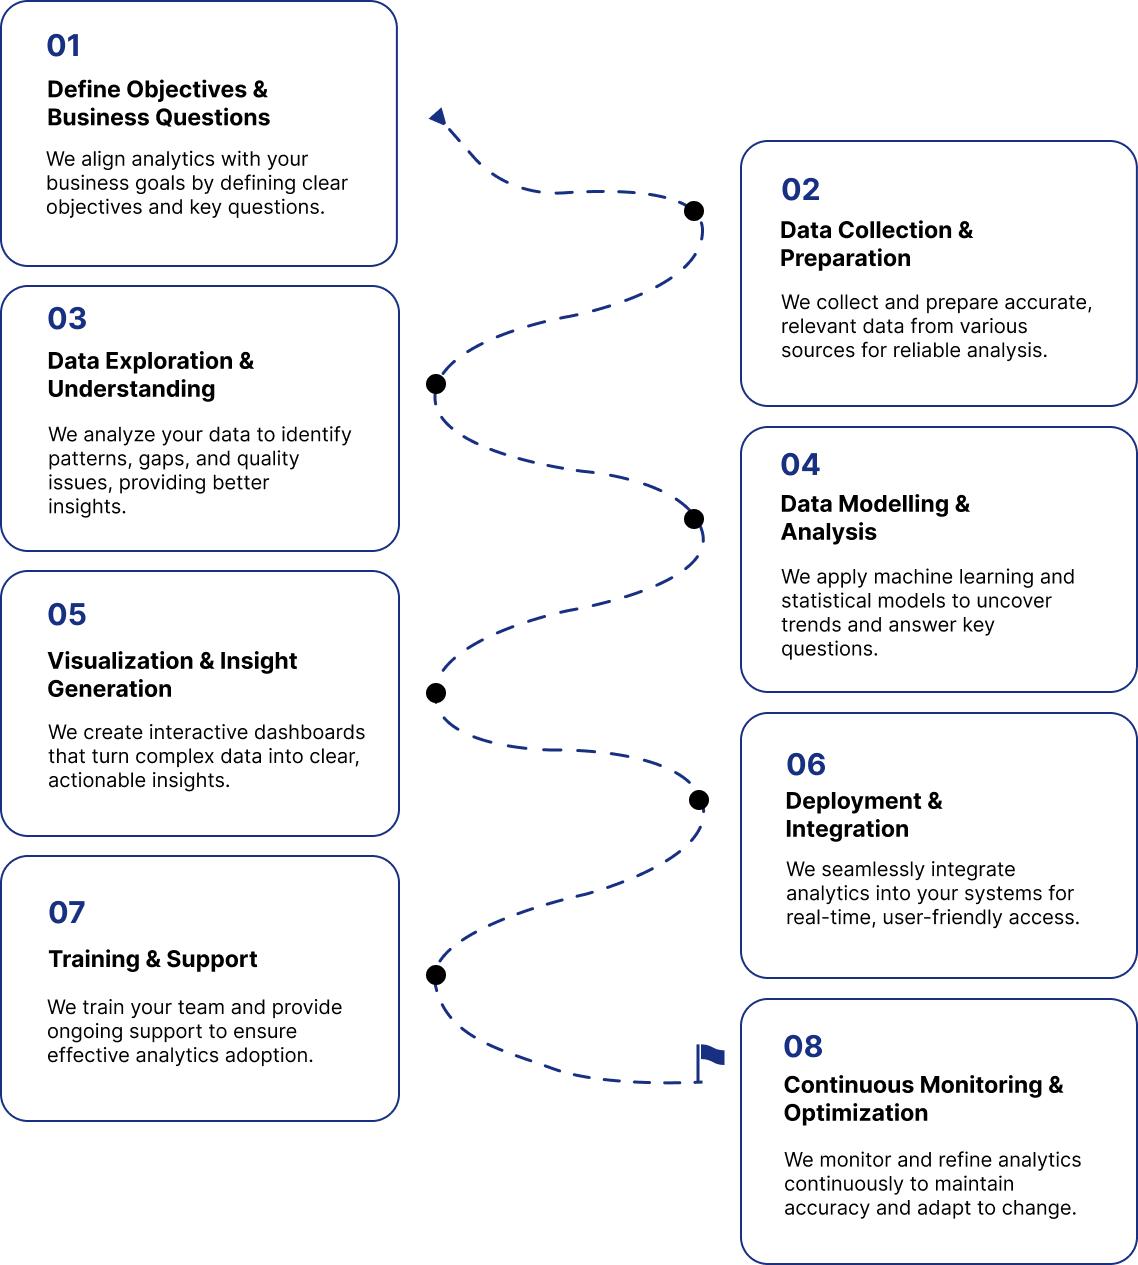
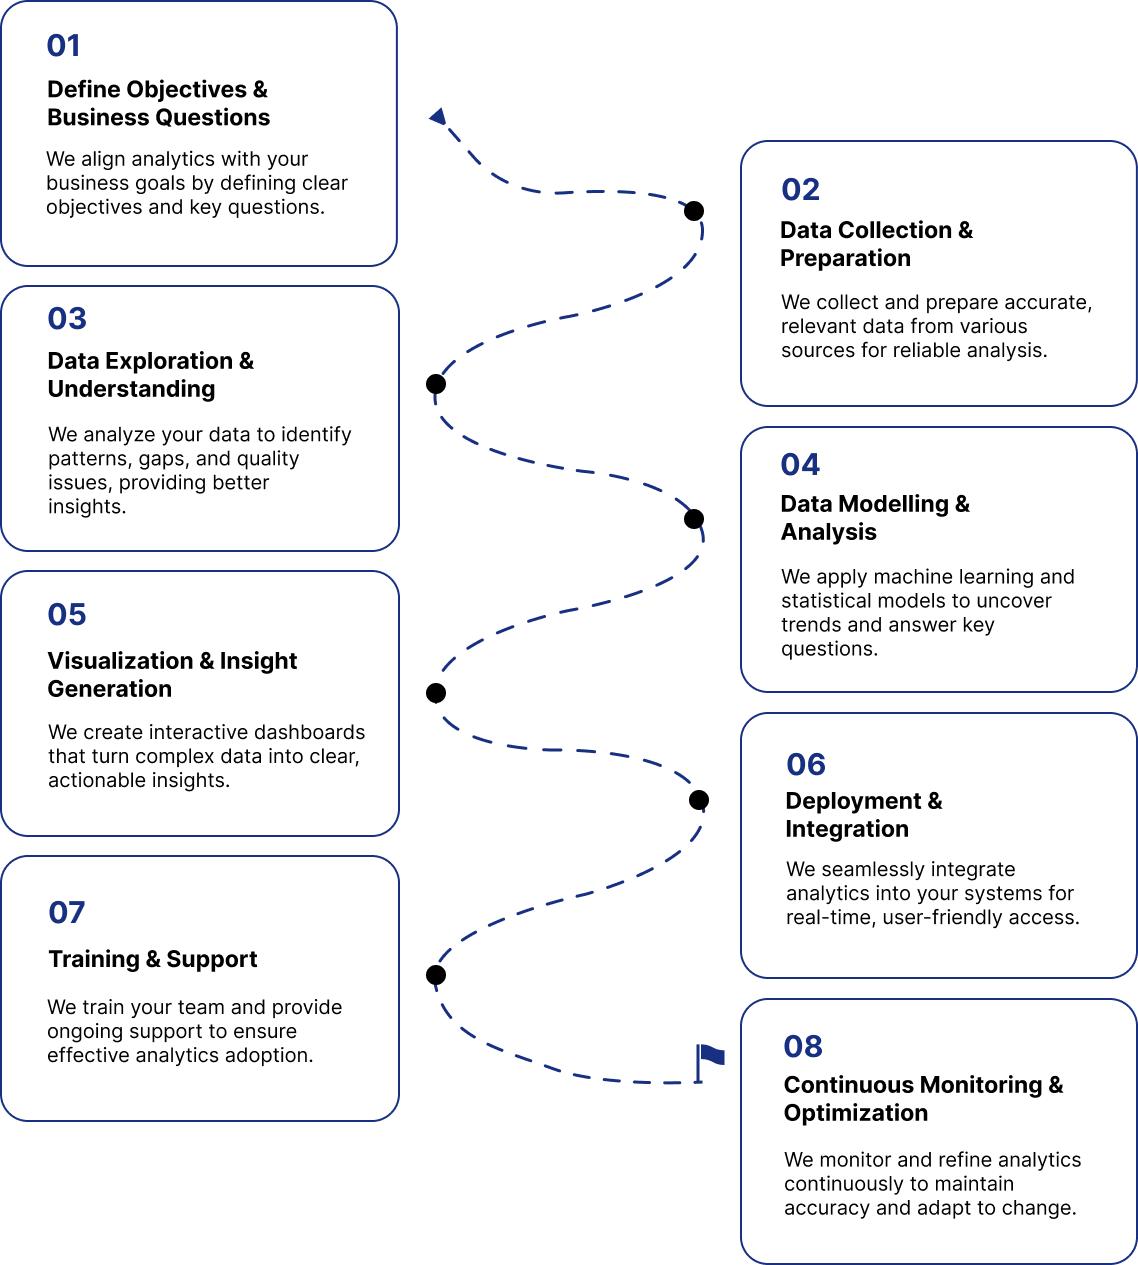
How Business Analytics Works

The process of business analytics transforms data into a well-defined decision. Although it might seem technical, the process follows a very straightforward pattern that most organizations go through, regardless of whether they are banks, retailers, or hospitals.

  • Define the objective: Begin by defining what needs to be answered. For instance, “Why do we have declining repeat orders?” or “Who is going to churn next quarter?” A poorly defined objective will yield a poor response.

  • Collect the relevant data: Get the data that pertains to the objective. This could be sales data, website activity, survey results, CRM, or payment data.

  • Processing the data: Raw data is always unorganized. There will be duplications in the data, missing data, and even incorrect data. By cleaning this up first, you avoid making decisions based on wrong data.

  • Analysis of the data: Look for patterns. Compare the revenues in each region, find out what led to the decrease in revenues, create a model that can predict the future, etc.

  • Visualize the results: Turn the findings into graphics and charts. A simple chart will allow a manager to see what takes one hour with the help of a spreadsheet in a minute.

  • Make the decision: Make the decision using the analysis of the data. Change the price, change the budget for advertising, or make improvements at the stage of the process.

See what happened after you took the decision. Did it bring good results? Or do you have to continue searching for the solution? Business analytics is a repetitive process, not a one-time activity. The results of the previous step go into the next goal, and the process continues.

Build Your Business and Decision-Making Skills with IIM Bangalore’s Emerging Leaders Program

Want to use business insights to make better decisions and take on greater responsibilities? The IIM Bangalore Emerging Leaders Program (ELP) for Working Professionals helps you strengthen your understanding of finance, strategy, customers, leadership, and data-driven decision-making.

Why choose this program?

  • Strengthen your strategic thinking and decision-making skills

  • Build financial knowledge to understand business performance

  • Learn to use data for better business decisions

  • Understand customer value and business strategy

  • Apply management concepts through a live business simulation and a faculty-guided project.

How Business Analytics works?

How AI Is Changing Business Analytics

AI is changing how fast analytics get done and who gets to do it. Here are the shifts worth knowing about.

  • Generative AI: This AI technology is capable of summarizing lengthy reports, describing graphs in simple terms, and generating code. It’s always important to verify the results produced by it before any action is taken.

  • Natural language queries: One can simply ask a question like “What was the most returned city in the last quarter?” without writing any code. This allows non-technical people to work with data.

  • Augmented analytics: The tool finds patterns and outliers for you and informs you of what else needs to be done. It saves a lot of time on routine tasks.

  • Agentic analytics: AI completes several tasks for you, including data retrieval, analysis, and summarization of results. However, it’s always important to verify the results manually, especially when the decision is significant.

  • Real-time analytics: Businesses can do real-time analysis of their data. For instance, such analysis may encompass fraud warnings, stock levels, and performance of marketing campaigns in real time. Hourly decisions replace weekly decisions.

  • Data governance: The more data that businesses feed into their AI system, the more crucial it will become for them to govern access to this data, its security, and its use. Otherwise, the data would turn out to be biased.

Best Business Analytics Tools

No single tool does everything. Teams usually combine a few best business analytics tools, depending on the stage of work.

Stage

Tools

What it is used for

Data collection and storage

SQL, Snowflake, BigQuery

Storing large data sets and pulling out the exact data needed

Analysis

Excel, Python, R

Cleaning data, running statistics, and building models

Visualization

Tableau, Power BI

Building charts and dashboards for teams and leaders

For a beginner, SQL and Excel are a practical place to start. Python and a visualization tool can follow once the basics feel comfortable.

Business Analytics Use Cases

Almost every function and industry uses analytics in some form. The table below shows common ways it is applied.

Function or industry

How analytics is used

Type of analytics involved

Marketing

Measuring campaign results, segmenting customers, estimating which leads will convert

Descriptive, predictive

Finance

Budget tracking, forecasting revenue, spotting unusual transactions

Descriptive, predictive

HR

Studying attrition, hiring patterns, and employee performance

Diagnostic, predictive

Supply chain

Forecasting demand, planning inventory, improving delivery routes

Predictive, prescriptive

Banking

Credit risk checks, fraud detection, customer behaviour analysis

Predictive, diagnostic

Ecommerce

Product recommendations, pricing, cart abandonment analysis

Predictive, prescriptive

Healthcare

Tracking patient flow, planning resources, studying treatment outcomes

Descriptive, predictive

Telecom

Understanding customer churn, planning network capacity

Diagnostic, predictive

Business analytics helps businesses understand their performance and make informed decisions. To plan how a business creates value, serves customers, and generates revenue, explore the Business Model Canvas.

Skills and Careers in Business Analytics

Business analytics rewards a mix of technical and thinking skills. These are the core ones.

  • Statistics. You need to understand averages, variation, probability, and basic testing so you do not misread the data.

  • SQL. It is the most common way to get data out of a database.

  • Visualization. Clear charts help people see the point without reading a table of numbers.

  • Storytelling. Findings only matter if decision makers understand them. You have to explain what the data says and what to do about it.

  • Data ethics. This means handling personal data responsibly, being open about limits, and avoiding biased conclusions.

Different roles lean on these areas in different ways. Here is a simple way to see it.

Role

Learning areas that matter most

What the work looks like

Business analyst

Business basics, Excel, SQL, storytelling

Turning business questions into data tasks and recommendations

BI analyst

SQL, dashboards, reporting tools

Building and maintaining reports and dashboards

Data analyst

Statistics, SQL, Python or R, visualization

Cleaning and studying data to find patterns

Data scientist

Advanced statistics, Python or R, machine learning

Building predictive models and testing them

Career outcomes depend on your background, skills, experience, and the job market. Learning analytics improves your options, but it does not promise a particular role or salary.

Business analytics can open doors to different career opportunities. If you are considering a career as a business analyst, read our guide on Business Analyst Salary in India to understand the earning potential for freshers and experienced professionals.

Who Should Learn Business Analytics?

Business analytics has several applications apart from technology teams, which are the biggest beneficiaries.

  • For working professionals. For those who deal with reports, goals, or decisions in their profession.

  • For managers. Because analyzing dashboards and posing better questions will lead to better decisions by the teams.

  • For financial and marketing teams. Because both these areas use numbers extensively.

  • For fresh graduates. It is a skill set that you can learn early in your career.

Conclusion

In essence, business analytics is just an intelligent way of doing business because it helps you make decisions based on facts.

Imagine a small online store experiencing a fall in sales in one city. The descriptive analytics will show the fall. The diagnostic analytics will point out the reason behind the fall, which is late deliveries. Predictive analytics will caution that the same issue might arise in other cities next month. Finally, the prescriptive analytics will offer a better delivery service partner. There you go; that one single example has covered everything under the sun.

So now you know what business analytics is, how the four kinds of business analytics function, what tools are used, and in what contexts. Whether you are a student, a manager, or any working professional, you can start off with Excel and SQL and move ahead.

Swati Bajaj

Swati Bajaj

2+ of articles published


Current role in the industry :

Associate - Content

About

Swati Bajaj is a content writer with close to 3 years of experience in the education space. She writes blogs, program guides, and web pages built around what students actually search for. She handles keyword research, content planning, and structuring, and she is good at turning complex topics into simple, easy reading. Her approach is straightforward: answer the real question, keep the language plain, and help readers make decisions with confidence.

No blogs published yet.

Latest Blogs

minimum viable product
Nov 1st, 2026

minimum viable product

A Minimum Viable Product (MVP) refers to the most fundamental form of a product with basic features, intended to prove an idea among initial users.

Frequently Asked Questions

General