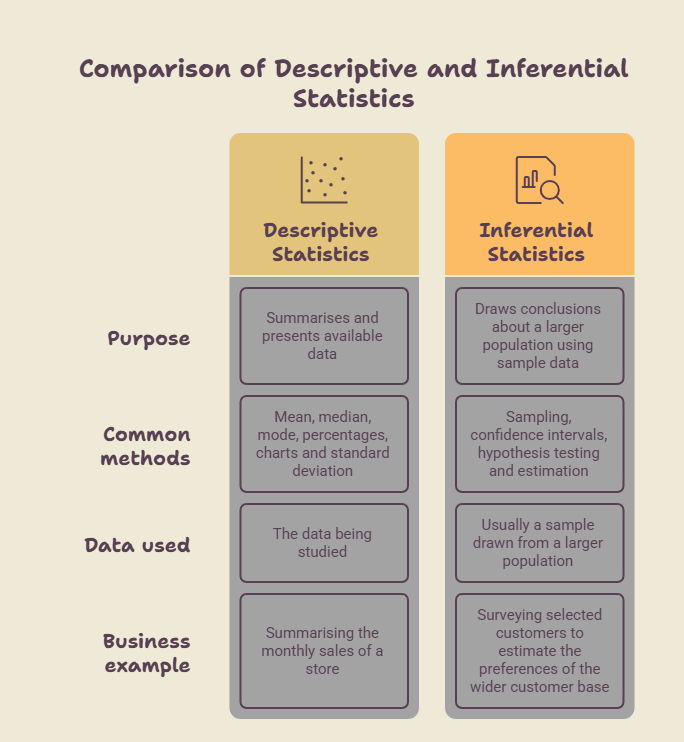
Descriptive Statistics
Descriptive statistics helps businesses understand existing information without making broader claims beyond the data being examined. It can show totals, averages, percentages and differences across periods or groups.
For instance, a company might use a bar chart to compare sales across its branches or calculate average order value to understand typical customer spending. These summaries make large amounts of data easier to review.
Inferential Statistics
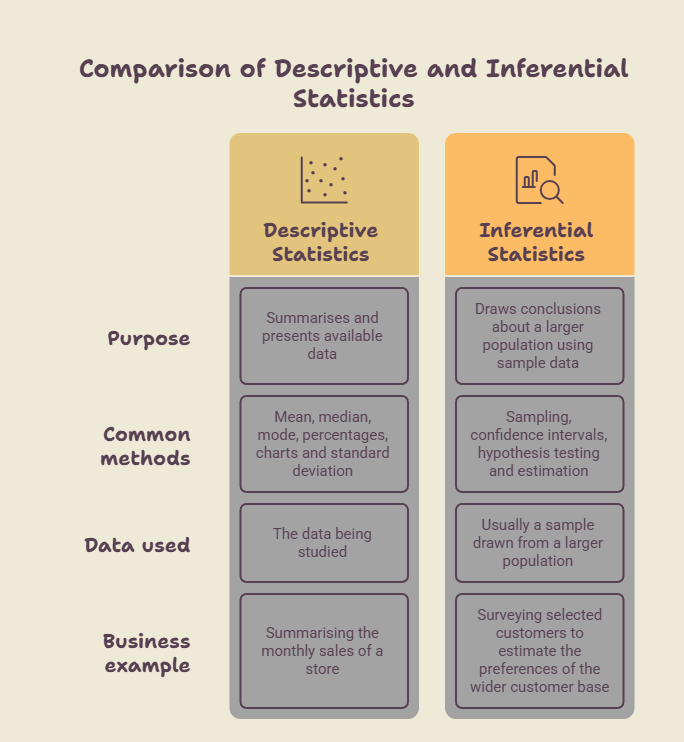
Inferential statistics uses information from a sample to estimate or draw conclusions about a larger population. Businesses use it when collecting data from every customer, employee or transaction is impractical.
For instance, when introducing products into the market, a firm can survey specific people in order to identify whether there is demand for the products. However, in this situation, the firm will need to evaluate aspects including sample size, sampling error, and bias in its evaluation.
Why Is Business Statistics Important for Decision-Making?
The use of business statistics makes decision-making a process guided by educated judgment.The uncertainties are not eliminated but it allows the manager to critically evaluate the evidence available before spending his resources.
Managers use statistical findings to plan activities, allocate resources, monitor performance and make informed decisions. Understanding the functions and importance of management also helps explain how managers put these insights into practice while working towards organisational goals.
Its importance can be seen in several areas:
Better planning: Past sales and seasonal trends can help businesses prepare budgets, set targets and plan inventory.
Customer understanding: Survey results and buying patterns can reveal preferences, common complaints and changes in demand.
Performance measurement: Revenue, costs, conversion rates and productivity figures help teams track progress against targets.
Risk assessment: Financial data and probability estimates can help businesses examine possible losses and compare options.
Resource allocation: Information can be used by managers to make decisions on where to allocate human and financial resources.
Problem identification: Unexpected changes in profitability, customers' feedback or defects in production process may indicate that there is something wrong that needs to be investigated.
The application of business statistics is very effective only when the business formulates a question that it wishes to ask from the information that it has collected. A huge report with plenty of figures does not guarantee a correct business decision. The managers have to take into consideration the real-life circumstances and limitations of the information available.
Business decisions are influenced by more than internal data. Explore our guide on PESTEL Analysis to understand how political, economic, social, technological, environmental and legal factors shape business strategies and planning.
How Is Business Statistics Applied Across Different Business Functions?
Different teams use statistics to answer different questions. Marketing teams study customer response, finance teams monitor financial performance, and operations teams look for ways to improve efficiency. The methods may overlap, but the purpose changes with the business problem.
Marketing and Customer Research: Teams analyse survey responses, campaign results and customer segments to understand preferences and measure marketing performance.
Finance and Risk Analysis: Finance teams review revenue, expenses, cash flow and investment data to compare performance and assess financial uncertainty.
Sales Forecasting and Demand Planning: Businesses examine historical sales, seasonal patterns and order trends to estimate future demand and plan stock levels.
Operations and Quality Control: Statistical measurements help teams monitor production, identify defects, compare process performance and investigate delays.
Human Resources and Performance Analysis: HR teams review attendance, employee turnover, recruitment data and performance measures to understand workforce trends.
These applications work better if data corresponds to the question asked. Website views, for instance, can not always give an answer to why a marketing campaign is inefficient or efficient. The analysis of purchases, conversion rate and costs can be also needed.
Interested in applying data analysis and business knowledge to solve organisational problems? Read our guide on Business Analyst Salary in India to understand earning potential, salary factors and career opportunities in this field.
What Are Some Real-World Examples of Business Statistics?
It is much easier to understand business statistics when it is connected to everyday business situations. A company does not need complicated software or a large research team to use it. Even basic calculations and comparisons can help answer practical questions.
Business statistics also helps managers assess team performance, track productivity and understand how resources are being used. These responsibilities are closely connected to the day-to-day work involved in becoming a manager, where analysing performance and making informed decisions are important parts of the role.
Business situation | Statistical method | How it helps |
A store wants to understand typical customer spending | Mean and median | Summarises spending and helps compare customer purchase values |
A company wants feedback on a new product | Sampling and survey analysis | Helps estimate customer interest before a wider launch |
A retailer needs to plan stock for the festive season | Trend analysis and forecasting | Helps estimate demand using past sales patterns |
A factory notices an increase in defective products | Percentages and process variation analysis | Helps track defect rates and identify when quality changes |
A marketing team compares two advertising campaigns | Conversion-rate comparison | Helps assess which campaign generated a higher proportion of desired actions |
A finance team reviews monthly expenses | Variance and percentage analysis | Shows how actual expenses differ from the budget |
These examples also show why context matters. An increase in sales can indicate positive trends; however, the firm also has to take into account the costs, discounts, and profit margins. In the same way, a high interest level regarding the product shown through surveys does not necessarily mean that the product will be sold successfully.
Statistical results should be treated as evidence for a decision, not as a substitute for judgement. Businesses also need to check whether their data is accurate, representative and relevant to the question.
Conclusion
Business Statistics aids an organization to improve the utilization of information already generated within the organization. Right from customer research to monitoring financial activities, organizing inventories to analyzing employee data; statistics provide support in decision-making in all these fields of business.
Learning Business Statistics is of value to anyone who is interested in Management, Marketing, Finance or any other aspect of business because knowing how to interpret the figures and understand their limitations along with the business question itself is the essence of learning Business Statistics.