Quick Overview:
Root Cause Analysis (RCA) is a systematic approach to identifying the underlying cause of a problem or defect so that it can be addressed and prevented from happening again.
Common RCA methods include the 5 Whys, Fishbone Diagram, Pareto Analysis, FMEA, Fault Tree Analysis, and Scatter Diagram Analysis.
Following a step-by-step RCA process helps businesses make informed decisions, improve efficiency, reduce errors, and develop long-term solutions.
This guide covers the meaning and importance of Root Cause Analysis, different RCA methods, the 5 Whys method, Fishbone Diagrams, the step-by-step process, practical examples, and the key benefits and limitations of RCA.
What Is Root Cause Analysis?
Root Cause Analysis (RCA) refers to a process where one identifies the true cause of a problem. RCA is not limited to the visible causes but enables individuals and organizations to uncover the true cause of the problem.
In root cause analysis, the main goal is to find the real reason behind the problem and take steps so that the problem will not recur in the future. Root cause analysis helps organizations to improve their processes, reduce mistakes, save time, and make good decisions. Some of the common techniques of root cause analysis are 5 Why Analysis, Fishbone diagram, and FMEA.
For instance, a company that constantly struggles with being late in delivering its products can deal with the issue by instructing its workers to move faster. However, root cause analysis can help find underlying causes for the issue, such as poor inventory management and issues with the supply chain. This will enable the company to become more efficient and avoid such issues in the future.
Why Is Root Cause Analysis Important?
Root Cause Analysis helps companies get to the bottom of the problems recurring in their systems rather than solving them temporarily. This is how it can make their teamwork more efficient.
Prevents recurring problems: Assists teams in identifying the root cause of a problem so that it does not recur.
Saves time and money: Saves time, effort, and money that would otherwise be required in solving the same problems all over again.
Increases efficiency: Enables teams to know the elements that make them less productive and ways to become more efficient.
Helps in decision making: Allows managers to be able to understand the problem well enough to choose the best way of solving it.
Helps maintain good relationships with clients: Enables organizations to resolve any issues that might affect the quality of their goods and services.
Helps improve continuously: Helps teams learn from their mistakes and improve.
What Are the Different Root Cause Analysis Methods?
There are many root cause analysis approaches which assist a team in finding out the reasons for a problem and solving it. The choice of an approach is based on the nature of a problem, its complexity, and data availability. These are some root cause analysis approaches.
1. The 5 Whys Approach
The 5 Whys approach entails posing questions "why?" continuously until one discovers the root cause of the trouble. This is a relatively simple technique to apply, especially in situations where there is cause-and-effect association.
Example: In the case where a machine breaks down, one would keep asking questions of why until they discover the reason, such as failure of maintenance.
2. Fishbone Diagram
Fishbone Diagram is also called the Ishikawa Diagram or Cause-and-Effect Diagram. The diagram helps in identifying and arranging all the different possible causes of a certain problem. Causes are grouped into different categories such as people, process, machine, and materials.
Example: When the quality of the product becomes poor, the team uses the Fishbone Diagram to see whether the problem arises from employee training, equipment, or poor-quality material.
3. Pareto Analysis
Pareto Analysis is used by groups to prioritize the cause factors that have the greatest impact on a problem. This technique uses the 80/20 rule, which states that many problems might stem from just a few cause factors.
For example, if a business faces complaints regarding several problems, then Pareto Analysis can be used to find out which problems form the greatest number of complaints.
4. Failure Mode and Effects Analysis (FMEA)
FMEA is a technique that helps identify failure modes within a product, process, or system. Risks are assessed on the basis of their severity, probability of occurrence, and detectability.
Example: A manufacturing group can use FMEA to determine which areas of a production process may result in defects in products.
5. Fault Tree Analysis (FTA)
Fault Tree Analysis makes use of diagrams that show various events or problems which could be responsible for causing the problem. This helps in determining the relationship between an individual failure and an overall effect.
Example: The Information Technology team could conduct fault tree analysis to figure out what could have caused the server crash problem.
6. Scatter Diagram Analysis
Scatter diagrams enable team members to analyze if two variables have any connection with each other. The pattern formed through graphs may be useful in finding out the cause of a problem.
Example: A business could compare the number of hours worked by the employees and the number of errors made.
What Is the 5 Whys Method in Root Cause Analysis?
The 5 Whys root cause identification technique is a rather simple strategy where you ask 'Why?' many times until you reveal the true cause of the problem in question. It is not necessary that there will be exactly five questions; the number may vary depending on the nature of the problem.
It is an effective approach since it allows people to go beyond the immediate problem and find out what needs to change in order for this problem not to occur again. It is most suitable for solving problems with a straightforward cause-and-effect relationship.
For example, imagine a company keeps missing its delivery deadlines. The team can use the 5 Whys method to investigate the issue:
Why is there a delay in deliveries? Because orders are not packed on time.
Why are orders not packed on time? Because some products are out of stock.
Why are products out of stock? Because the inventory levels are not updated regularly.
Why are the inventory levels not updated regularly? Because the team depends on manual inventory management.
Why does the team depend on manual inventory management? Because there is no automated inventory management system in place.
The basic problem lies in the absence of an efficient inventory tracking system. Solving this problem will help the company to control its inventory levels and delivery times.
Read More: PESTEL Analysis: 6 Factors, Framework and Examples
What Is a Fishbone Diagram in Root Cause Analysis?
This diagram tool is commonly used for RCA to find and organize possible sources of a problem. It is also called Ishikawa Diagram or Cause-and-Effect Diagram as its purpose is to help a team identify the connection between the problem and its source. The appearance of a fishbone diagram can be compared to a fish skeleton as there is a central line representing the problem with other branches leading from it.
These factors usually fall into groups like people, process, equipment, material, and environment. This way, it becomes easier to examine various possibilities, discuss underlying causes, and determine which areas require further examination.
For instance, when a manufacturing firm observes higher defect rates in its products, the team can use a Fishbone Diagram to analyze the underlying causes, which may include insufficient training of workers, malfunctioning machines, poor quality of material, or confusing procedures. Once the causes have been determined, further investigation can be conducted.
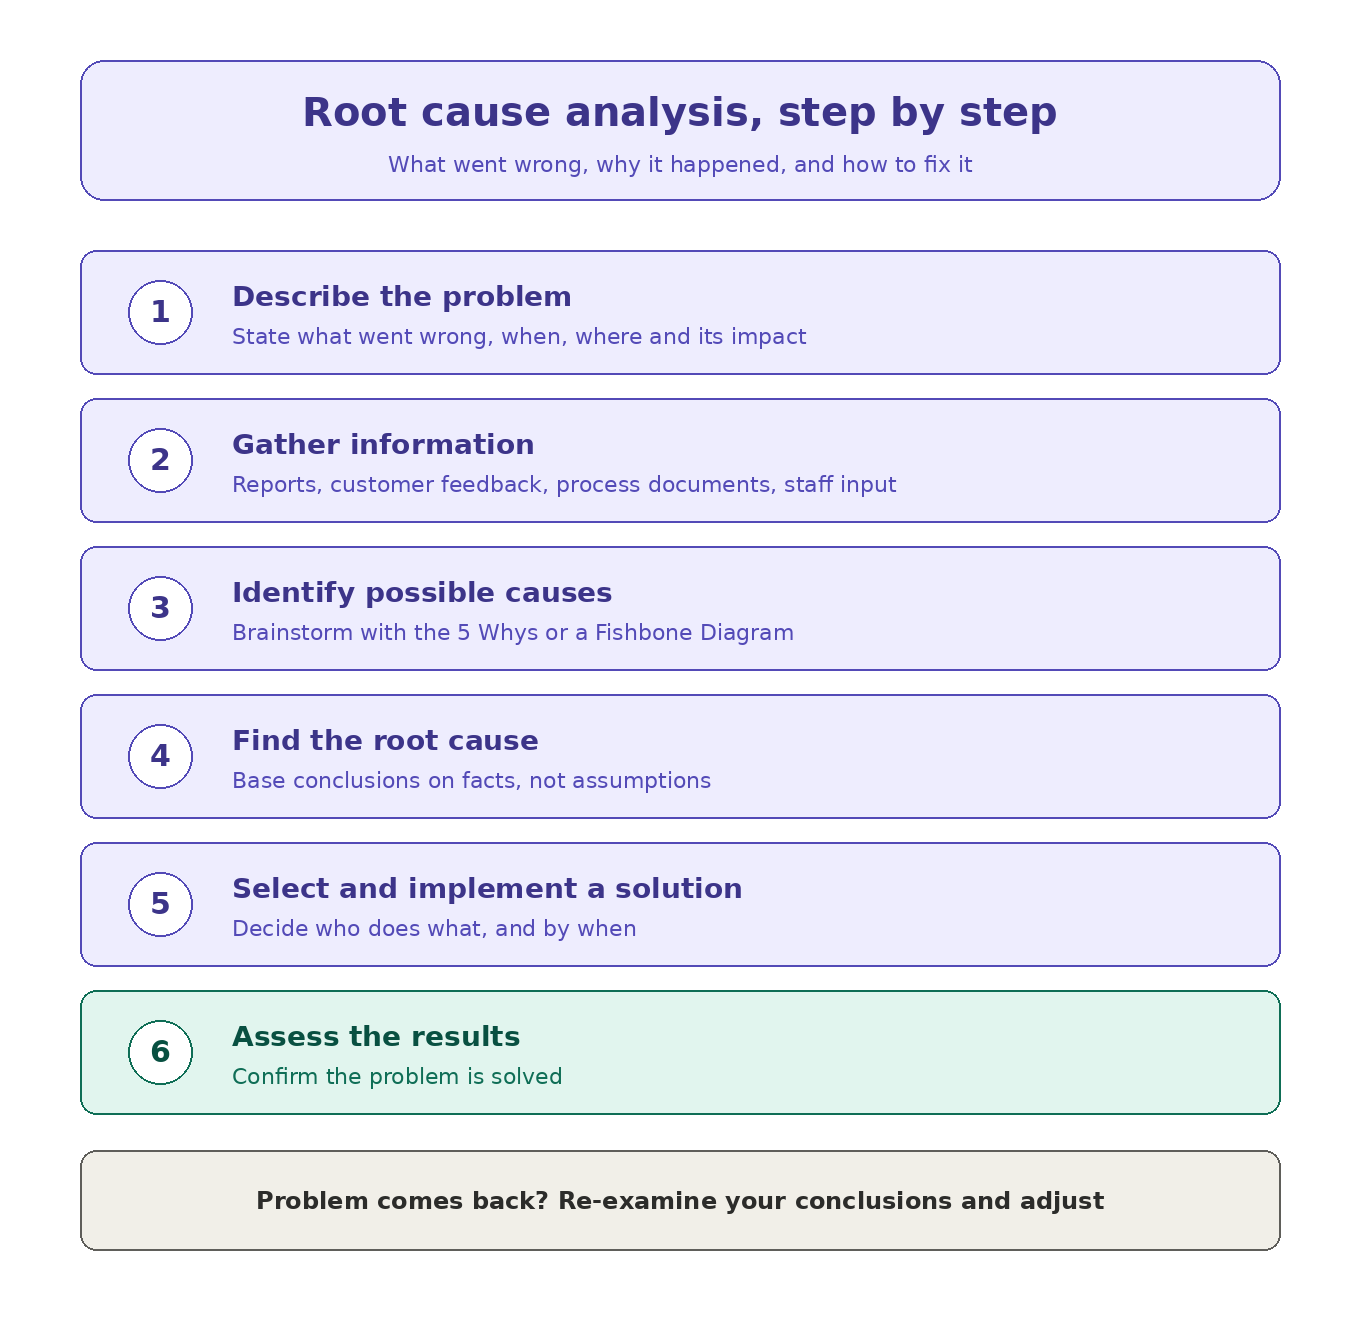
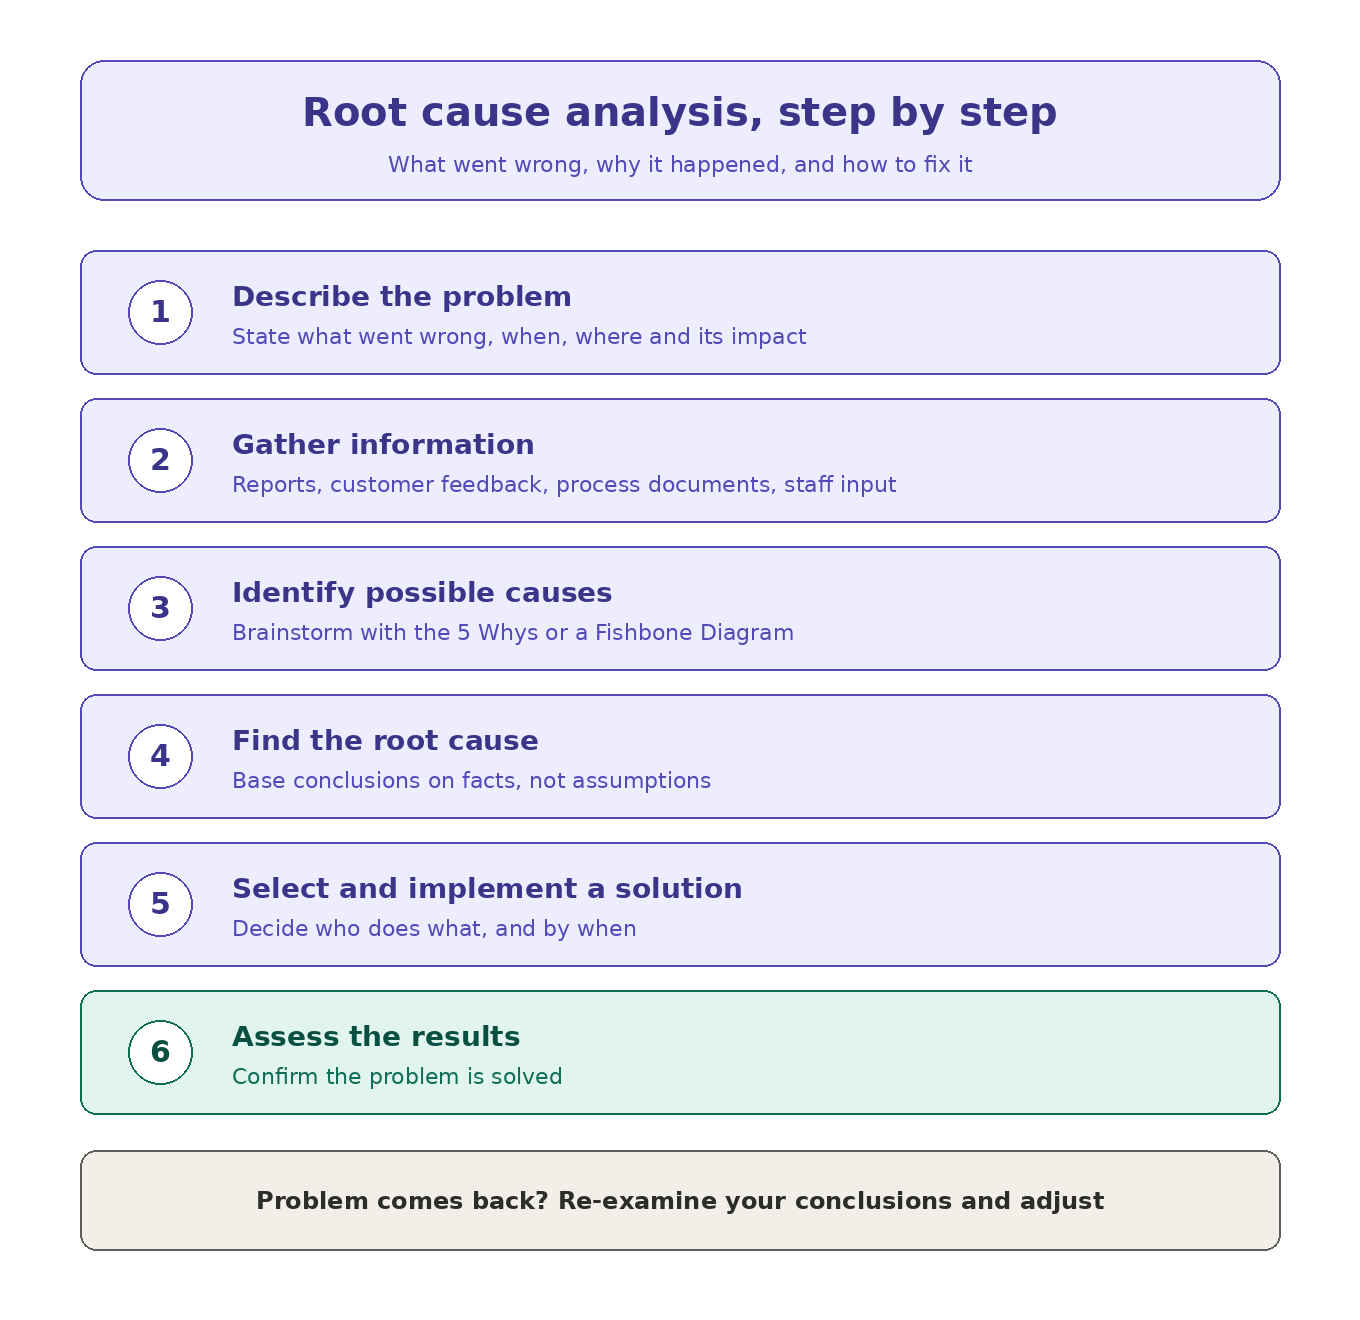
How to Perform Root Cause Analysis Step by Step
It becomes much simpler for you to perform Root Cause Analysis once you start breaking it down into steps. The purpose of Root Cause Analysis is to determine what went wrong, why it happened, and how it can be fixed.