
IIMBx - Digital Learning Foundation

Financial Statement Analysis: Methods, Ratios and Examples

By Khushi Upadhyay

Updated on Oct 28, 2026

Share:

Ever looked at a company’s numbers and wondered what they really say about its health? Financial statement analysis helps you find out.

  • Financial statement analysis is the way you read a company’s balance sheet, income statement and cash flow statement to see how the business is really doing. 

  • Managers, entrepreneurs and finance learners use it to check profit, cash and risk before they make a decision. 

This guide will tell you about financial statement analysis in more detail. It covers the three statements, methods, key ratios, a worked example, and ways to keep learning.

What Is Financial Statement Analysis?

Definition: Financial Statement Analysis is when you look at a company's Balance Sheet, Profit and Loss Statement, and Cash Flow Statement in order to understand how the business is performing. 

You can turn numbers into meaningful information such as:

  • How profitable is the business?

  • How likely is the business to pay its bills?

  • Is the business in debt? 

That is the meaning of financial statement analysis in simple words. You are not just looking at numbers. You are asking what they say about profit, cash and risk. 

Who uses this?

  • Management: to help them create budgets and keep costs down.

  • Investors: to help them understand if they should invest in the company.

  • Lenders: to help them understand if the business will be able to repay their loan.

Let's understand it with an example: Kabir owns a small furniture business.

  • Profit and Loss Statement: Last year his sales were ₹20,00,000, and he made a profit of ₹2,00,000.

  • Balance Sheet: He has debts to the bank and suppliers of ₹6,00,000 and owns assets worth ₹15,00,000.

  • Cash Flow Statement: He has received ₹1,50,000 of cash from his customers. Even though he made a profit of ₹2,00,000, he hasn't received payment from all of his customers.

When Kabir reads these together, he learns three things. The business is profitable, the debt is manageable, but cash is coming in slower than profit. So he decides to follow up on customer payments and avoid new spending until cash improves. A bank manager, an investor or Kabir himself would read these same numbers to make a data driven decision making. That is what financial statement analysis does.

Want to learn about Financial Management? Check out this What Is Financial Management? Objectives, Functions and Types

The Three Financial Statements You Need to Read

Before analysing a company, it’s important to understand that these three statements show you what a company owns, how much money it makes, and the movement of its cash.

Balance sheet

This is a snapshot of a company at a specific point in time. It shows what a company owns (Assets), owes (Liabilities) and what belongs to the owners (Equity). The balance sheet is prepared by keeping assets = liabilities + equity.

Profit and Loss / Income Statement

This will show you what the company made over a period of time such as a month or a year. It starts with revenue, then subtracts expenses to leave a profit. This shows you if the company is making more money than it is spending.

Cash Flow Statement

This will tell you exactly how much cash has come into and gone out of the company. It can be split into 3 sections;

  • Operating activities - Cash from daily operations e.g. sales and paying suppliers.

  • Investing Activities - Cash spent on buying/selling assets like machines or property.

  • Financing Activities - Cash received from borrowing money, selling shares or repaying.

Statement

What It Shows

Key Question It Answers

Balance Sheet

Assets, liabilities and equity on a given date

What does the business own and owe?

Income Statement

Revenue, expenses and profit over a period

Is the business making a profit?

Cash Flow Statement

Cash coming in and going out through operating, investing and financing activities

Does the business have enough cash?

Methods of Financial Statement Analysis

There are a few common ways to analyse financial statements. These can be referred to as the tools/techniques of financial statement analysis. They help provide a more complete view when used together.

Horizontal Analysis

This compares the same figure between different years.

  • Formula: Percentage change = (Current year amount − Previous year amount) ÷ Previous year amount × 100

  • What it shows: Growth or decline over time.

  • Example: Revenue rises from ₹16,00,000 to ₹20,00,000. The change is (20,00,000 − 16,00,000) ÷ 16,00,000 × 100 = 25%.

Vertical Analysis

This shows what % each line item makes up of the base figure. This is usually revenue for the income statement and total assets for the balance sheet.

  • Formula: Percentage of base = (Line item ÷ Base figure) × 100

  • What it shows: How the business is built, and where most of the money goes.

  • Example: Cost of goods sold is ₹12,00,000, and revenue is ₹20,00,000. So 12,00,000 ÷ 20,00,000 × 100 = 60% of revenue.

Ratio Analysis

This uses basic calculations to compare 2 numbers. This could be comparing profit to revenue or current assets to current liabilities. It helps with comparing large numbers.

  • Formula: Ratio = Number A ÷ Number B. For example, Current ratio = Current assets ÷ Current liabilities

  • What it shows: Profit, liquidity, debt levels, and efficiency.

  • Example: Current assets are ₹6,00,000 and current liabilities are ₹3,00,000. So 6,00,000 ÷ 3,00,000 = 2.0.

Benchmarking

This compares the numbers of the company to others in the industry or the average of the industry. It tells us if the figures are performing well or not for that type of business.

  • Formula: Difference from benchmark = Company ratio − Industry average ratio

  • What it shows: How the business performs against others in its field.

  • Example: A company has a net profit margin of 11.25%, while the industry average is 8% (a made-up figure). The difference is 11.25% − 8% = 3.25 percentage points above the average.

Key Financial Ratios With Formulas

Financial statement analysis ratios turn large numbers into simple comparisons. They help you judge a company’s short-term strength, profit, debt, and efficiency at a glance. Here are the main ones, grouped by what they measure.

Ratio Type

Ratio

Formula

What It Tells You

Liquidity

Current ratio

Current assets ÷ Current liabilities

Whether the business can pay its short-term bills

Liquidity

Quick ratio

(Current assets − Inventory) ÷ Current liabilities

Whether it can pay bills without selling its stock

Profitability

Net profit margin

(Net profit ÷ Revenue) × 100

How much profit each ₹100 of sales earns

Profitability

Return on equity (ROE)

(Net profit ÷ Shareholders’ equity) × 100

How well the owners’ money is used to earn profit

Profitability

Return on assets (ROA)

(Net profit ÷ Total assets) × 100

How well the company’s assets create profit

Leverage

Debt-to-equity ratio

Total debt ÷ Shareholders’ equity

How much the business relies on loans compared with owners’ money

Leverage

Interest coverage ratio

EBIT ÷ Interest expense

Whether operating profit can cover interest payments

Efficiency

Asset turnover

Revenue ÷ Total assets

How well assets are used to generate sales

Efficiency

Inventory turnover

Cost of goods sold ÷ Average inventory

How fast stock is sold and replaced

Quick notes on the terms

  • EBIT means earnings before interest and tax, or the profit from operations before paying interest and tax.

  • Total debt usually means loans and borrowings, and some analysts include other long-term obligations.

  • Average inventory is (opening inventory + closing inventory) ÷ 2. If you only have one figure, use the closing inventory.

If you want to build financial skills alongside strategy, operations and people management, explore the IIM Bangalore General Management for Young Leaders program.
Financial Statement Examples in Real Life

Let’s work through one full example. The company below, Sunrise Traders, is fictional. All numbers are made up and used only to explain how the ratios work.

Balance sheet (year-end)

This is an example of balace sheet made at the year end

Item

Amount (₹)

Cash

1,00,000

Receivables

2,00,000

Inventory

3,00,000

Current assets

6,00,000

Fixed assets

9,00,000

Total assets

15,00,000

Current liabilities

3,00,000

Long-term debt

5,00,000

Shareholders’ equity

7,00,000

Total liabilities and equity

15,00,000

Income statement (for the year)

This is an example of an income statement

Item

Amount (₹)

Revenue

20,00,000

Cost of goods sold

12,00,000

Gross profit

8,00,000

Operating expenses

4,00,000

EBIT (operating profit)

4,00,000

Interest

1,00,000

Profit before tax

3,00,000

Tax

75,000

Net profit

2,25,000

Step-by-step ratios

  • Current ratio = Current assets ÷ Current liabilities
    6,00,000 ÷ 3,00,000 = 2.0
    Meaning: The company has ₹2 of current assets for every ₹1 of short-term bills.

  • Net profit margin = (Net profit ÷ Revenue) × 100
    (2,25,000 ÷ 20,00,000) × 100 = 11.25%
    Meaning: It earns about ₹11.25 of profit on every ₹100 of sales.

  • Debt-to-equity = Total debt ÷ Shareholders’ equity
    5,00,000 ÷ 7,00,000 = 0.71
    Meaning: Its loans are a little smaller than the owners’ money, so debt is moderate.

  • Interest coverage = EBIT ÷ Interest expense
    4,00,000 ÷ 1,00,000 = 4.0
    Meaning: Operating profit covers the interest four times, so loan payments look safe.

What this tells us: Sunrise Traders can pay its short-term bills, earns a healthy margin and carries moderate debt. A real analyst would also compare these ratios with past years and industry peers before drawing a final view.

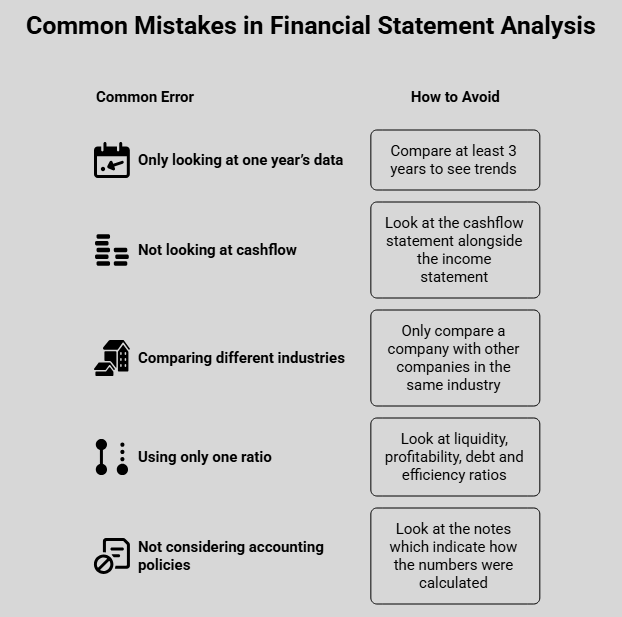
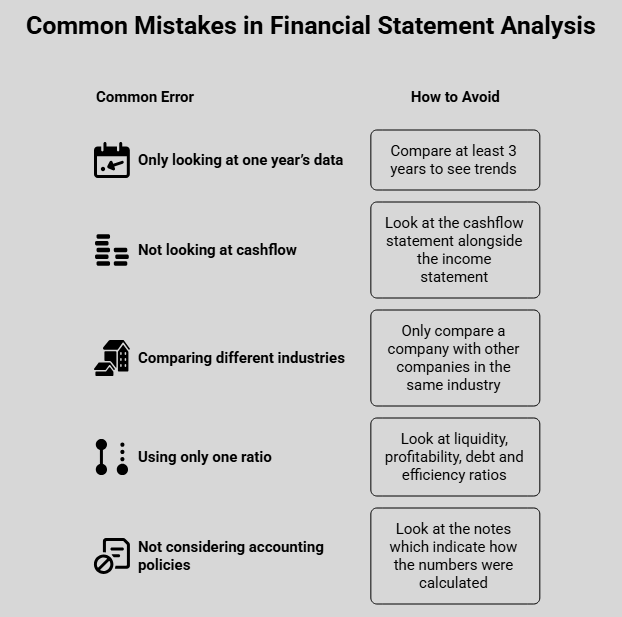
Common Mistakes in Financial Statement Analysis

Even if you are careful not to make mistakes in interpreting the financial numbers, there are some commonly made errors. Below are 5 common errors and how to avoid them.

Common Mistakes in Financial Statement Analysis
  • Only looking at one year’s data - Looking at only one year can be misleading. You should compare at least 3 years to see trends. For example even if they seem profitable this year they may be declining.

  • Not looking at cashflow - Even though the business is making a profit they may be running out of cash. This could be down to customers not paying on time. You should always look at the cashflow statement alongside the income statement.

  • Comparing different industries - A retail shop, software company and factory will operate very differently. Only compare a company with other companies in the same industry.

  • Using only one ratio - It is unlikely that one number will give you the whole story. If they have a high profit margin they may also have high levels of debt. Look at liquidity, profitability, debt and efficiency ratios.

  • Not considering accounting policies - The accounts will include notes which indicate how the numbers were calculated (ex. How stock was valued or revenue recognised). If you don’t look at them you may get misleading comparisons.

Build Your General Management Skills with IIM Bangalore’s Emerging Leaders Program

Ready to move from doing the work to leading it? The IIM Bangalore Emerging Leaders Program (ELP) for Working Professionals helps you build working depth in leadership, finance, customers, strategy and data-driven decision making. It prepares you to take on broader, cross-functional ownership in your organisation.

Why choose this program?

  • Build leadership skills to manage people, performance and conflict

  • Strengthen your financial acumen and understanding of customer value

  • Sharpen your strategic thinking and data-driven decision making

  • Apply leadership concepts in The Arena, a live business simulation

  • Work on a real problem in your own organisation through a faculty-guided action learning project

Who Should Learn Financial Statement Analysis?

Everyone can benefit from reading financial statements; below are some of the key groups that will benefit the most.

Who should learn about financial statement analysis.
  • Students / New Graduates: Provides a foundation for those wanting to follow a career in finance, commerce, or management. Can help during interviews and case studies.

  • Managers: Enables you to understand budgets, see how your company is performing, and provide data to support your decisions.

  • Entrepreneurs: Shows how healthy your business is so you can confidently plan your future growth, borrowing, and spending.

  • Finance Professionals: A fundamental skill for those looking to work within finance, for example, financial analyst, investment analyst, and finance manager.

Conclusion

Financial statement analysis helps you see beyond the numbers. By reading the three statements, using methods like horizontal and vertical analysis, and checking key ratios, you can judge a company’s profit, cash, and risk with more confidence. If you want to learn this in a structured way, the courses on IIMBx are a good place to start. Pick one small company, work out a few ratios, and build your skills from there.

Khushi Upadhyay

Khushi Upadhyay

4+ of articles published

Top Contributor

Associated with upGrad since 05 Nov 2024


Current role in the industry :

Senior Associate - Content

Education Qualification :

B.Com

Tools & Technologies :

SemrushGrammarly

Certifications :

Master's Certificate in Digital Marketing

About

Khushi Upadhyay is a Senior Associate - Content with 3+ years of experience in SEO, content strategy, blogs, and program pages. She creates engaging, search-focused content that improves organic visibility and connects with readers.

No blogs published yet.

Latest Blogs

minimum viable product
Nov 1st, 2026

minimum viable product

A Minimum Viable Product (MVP) refers to the most fundamental form of a product with basic features, intended to prove an idea among initial users.

Frequently Asked Questions

General